

Very Plotter
 This is definitely not just any old quick project to plot and view points from mathematical sequences. This is Very Plotter.
Edit: The Mandelbrot set is now the default plot shown by Very Plotter. See info about that on this next blog post.
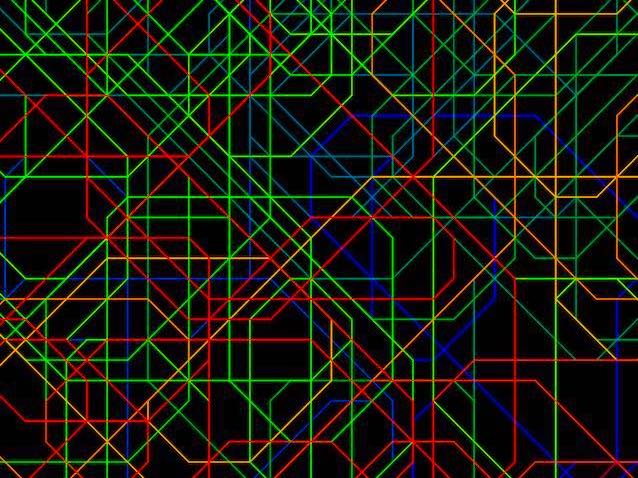
For a while now I've had a note to myself to program a way to view prime numbers. I'm not sure where the idea came from (though perhaps inspired by a Numberphile video on YouTube). The specific idea was to draw a single line representing integer numbers. For each integer, the line would continue forward one "step" (one unit of measurement, it doesn't matter what it is). But if that integer is prime, first turn 90 degrees to the right before taking that step. I supposed that the line would look interesting and randomly squiggly, and, after programming this thing, I can say that yes it does appear interesting and randomly squiggly.
Here are integers 1 - 700,00 (click to view on Very Plotter):

Development
Working a little here and there, Very Plotter took a week or so to get to a "version 0.1" equivalent point. Plotting and drawing points was the easy part, thanks to the JavaScript <canvas> API. The hardest part of this project was figuring out the mouse wheel zoom, where the zoom in/out appears to be centered on the mouse cursor location. This involved some algebra with all the scale and offset parameters, as well as mouse position. It was also surprisingly difficult to get mobile/touch events to work as expected (with Safari and Firefox on iOS).
I could not get the touchmove event, for dragging the graphics around with a finger, to work with Safari on iOS 14. Firefox on iOS 14 worked just fine. I had iOS 15 running on another device, and it did work as expected there. After updating my phone to iOS 15 it finally worked as expected. I don't know if it was just a problem with my device or if iOS 14 was doing something non-standard with Safari touch events, but I'd guess it was the latter. This is sometimes the frustrating part of developing for the web, and it's unfortunate that touch events are still not quite standardized and causing wasted development time.
After getting the prime number visualization working, I was able to pull apart the point sequence-generating part of the code to generalize it, allowing me to swap between different algorithms for generating sequences.
Apply nice color schemes to the lines wasn't very difficult. I attempted to use JavaScript <canvas> gradients, but that quickly got pretty complicated. Instead, I use simple linear color shifting between a pair of colors where each straight line segment is drawn with one solid color. I track the total length of all segments so I can give each segment a color based on its position in the complete plot. In other words, if creating a gradient from orange to purple, and a given segment begins 25% of the way though the overall plot, that segment will be 25% purple and 75% orange.
Seguences
The algorithm described in the first paragraph (turning 90 degrees on primes, and stepping forward once for all integers) worked better than I expected, so I created another "sequence" to view: turning 45 degrees on primes instead of 90. This creates a similar plot but with lots of parallel diagonal lines.
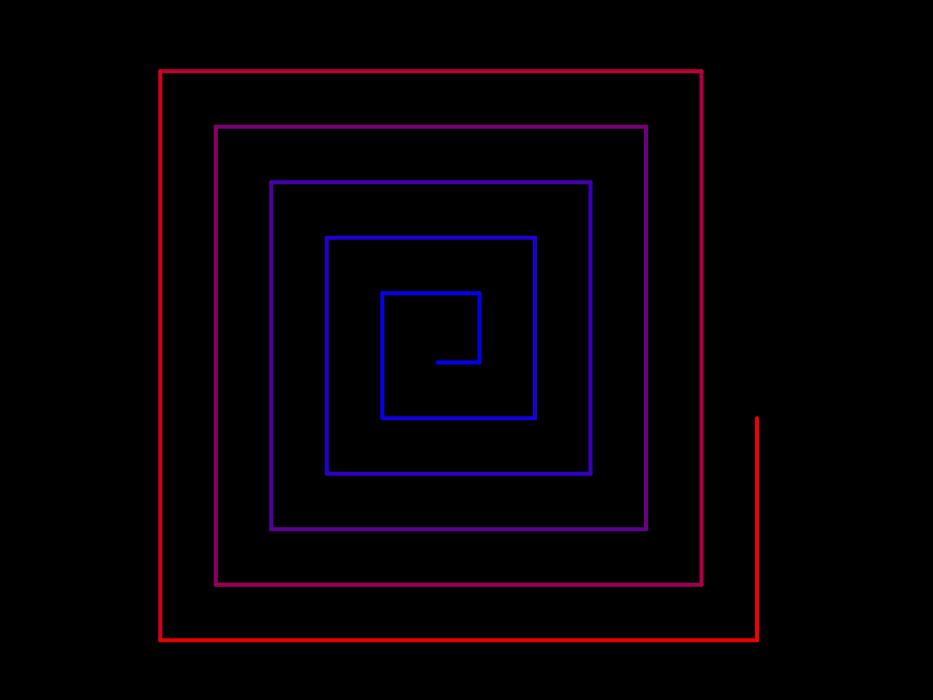
I thought that turning on perfect squares instead of primes would create a spiral, and that hunch turned out to be true. The plots for turning 90 and 45 degrees on squares aren't that interesting but they're useful for debugging the line coloration code.
The next sequence I thought to plot was the "Trapped Knight" sequence from a Numberphile video I'd seen a while ago. This is sequence A316667 on the OEIS and it was featured in the great Numberphile video here. If you're at all interested in this stuff I highly recommend watching the video. I calculate this plot by first brute force calculating the spiral-numbered chessboard squares, then brute force calculating where the knight can jump to according to the rules of the OEIS sequence. There may be a better way to do it but this generates what appears to be the same plot. It's fun to look at.

Future Plans
I'd like to add more plots to look at, including fractals and other things. I suppose I'm interested in simple algorithms that create unexpectedly interesting or complex plots.
I'd also like the page to be able to plot just points as opposed to lines, or cells for cellular automata.