Perturbation Theory and the Mandelbrot set
 I've recently been following the well-worn path of Mandelbrot set computation and rendering in my onoing development of Very Plotter. In my last blog post, I mentioned how fast floating point math was used for more "zoomed out" images, and slower arbitrary precision math was used otherwise. In this post I'll discuss the breakthrough of Perturbation theory, which allows fast floating point math to continue to be used as we dive deeper into the set.
By applying perturbation theory to the Mandelbrot set problem, images that would normally take days to calculate can be completed in minutes!
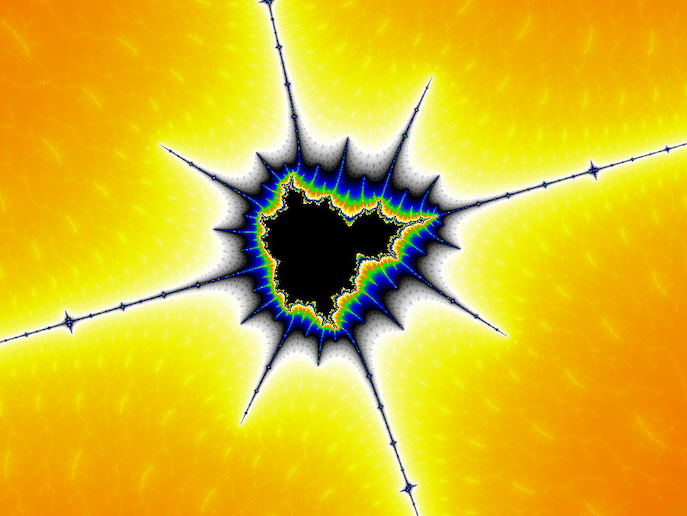
The above image is "Tick Tock" by Dinkydau (original post here). It was computed with perturbation theory in Very Plotter. Click the image to go to this location in Very Plotter.
Before we get into perturbation theory itself, I'm going to outline the basics of Mandelbrot set computation. If you're familiar with the basics, you can skip ahead.
The Basics
This post assumes prior knowledge of some computing and programming concepts, such as floating point numbers. At a high level, computers can perform math operations (add, multiply, etc.) on two "floating point" numbers with one instruction, with physical hardware doing the actual work, more or less instantaneously. This allows "zoomed out" views of the Mandelbrot set to be computed very quickly. When "zoomed in" images are desired, the numbers have too many digits (too many bits) to fit into regular floating point values. The math now has to be done in software, which requires manipulating these digits by executing many instructions. It is many times slower to do math on these larger numbers. This post covers a method for allowing floating point math to be used at very "zoomed in" locations, greatly speeding up the computation.
Now let's briefly outline how the Mandelbrot set is calculated. Take this equation:
In written form, you could say:
"Start with zero. Square it, then add some number c.
Take that value, and square it. Then add that number c again.
Take that value, and square it. Then add that number c again.
..."
What are these values of c? We perform these calculations with "complex numbers" which look like this:
Notice there are two components, , a real number, and , an imaginary number (a multiple of the imaginary unit , the square root of ). We call the real component, and the imaginary component.
We can use any real component , and any imaginary , to create a value for . To make pretty pictures with these two components, we can display them on the regular 2-dimensional plot that we're all used to, with the x axis (left and right) and y axis (up and down). For a complex number , we put its real component on the x axis, and its imaginary component on the y axis. The point is where those two values meet on the plot. So every position on the plot (and every pixel in an image) represent some value we can use for .
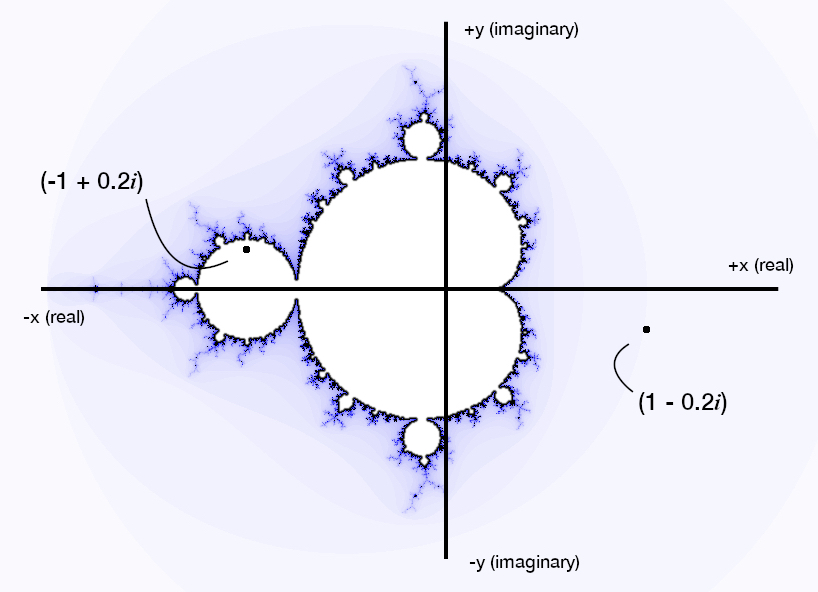
As an example, in this plot, we show two values for , and :

Notice how is in the Mandelbrot set (inside the interior of the bulbous shape), and is not in the Mandelbrot set (outside of the bulbous shape). When drawing the Mandelbrot set, for each each pixel in the image, we find its real and imaginary components and plug it into the equation above.
We refer to each time we run the calculation as an "iteration." For some values of c, like the point, after repeating this for several iterations, the value may get very large and head off toward infinity. When this happens, we bail out of the loop, and stop calculating. These values are not in the Mandelbrot set, though they do appear in the generated images. Depending on the number of iterations before we have to bail out, we select a color for the pixel. The Mandelbrot set is the set of values of c that never go off toward infinity when iterated in the equation. The other point in the above image, , is an example. These pixels are typically colored black. As we repeatedly iterate the equation for a particular point , it will generate a list of points bouncing around the plot sporadically. This series of points generated from the one original point is called 's "orbit".
Before going further it would help to be more precise when talking about "zoom" and scale. Very Plotter uses a "scale" parameter, which is the number of pixels per plot unit. At a scale of 100, a line drawn along the x axis from x=1 to x=2 would be 100 pixels long. In other words, at a scale of 100, the entire Mandelbrot set fits into an image 250 pixels wide. This is a very small scale value, where fast floating point math can be used. At a scale of 3e13 , that same line drawn from x=1 to x=2 would be 30 trillion pixels long. Around this scale, JavaScript floating point values can no longer carry enough precision to reliably keep one pixel separate from its neighbors, and the Mandelbrot set cannot be computed accurately with built-in JavaScript math.
Lastly, let's define the "absolute value" of these complex numbers, commonly written as . The absolute value is the straight line distance from the point back to the center . For the number , the distance to the center is . The number , also has an absolute value of . Using the Pythagorean theorem, we can say the distance is the square root of . For example, if an imaginary number is , we can compute to be
Measured with a single straight line, the point is units from the center.
The absolute value of an imaginary point is needed so we can tell when to bail out. In short, whenever we are iterating a value using the Mandelbrot equation, if the absolute value ever reaches , we know the point will eventually reach infinity — we don't have to keep iterating that value (we say our "bailout" value is ).
Escape Time Algorithm
Putting this all together, we can draw the Mandelbrot set. Pick a scale value, and a maximum number of iterations to perform (say, 100). Calculate the position (from our original equation, the c value) for each pixel, then perform the simple "square, then add" equation. If the absolute value of the result is 2 or more, stop. Otherwise, iterate again.
If we iterate 100 times and a pixel still hasn't reached 2, we will color that pixel black (it's a member of the Mandelbrot set). For all other pixels, we pick a color based on the number of iterations before it reached 2 (that pixel's "escape time.")
Perturbation Theory
This is where Very Plotter was last month, and this is where the state-of-the-art Mandelbrot set explorer software was in 2013. Fast floating point calculations were used at scales up to around 1e13, then extremely slow arbitrary precision math at all scales beyond that.
In 2013, a "mrflay" user on the fractalforums.com discussion board, out of the blue, announced1 his new technique of applying perturbation theory2 to the Mandelbrot set computation algorithm. This breakthrough allows regular floating point values to be used at larger scales, well beyond the previous 1e13 limit. This means images that used to take days to calculate could now be finished in minutes!
This brief PDF3 was shared along with that original post, and it outlines the math involved with this new technique. (Also included in the PDF, and just as important, is the application of Series Approximation to the computation, but I'll discuss that in a later blog post.)
Perturbation theory is apparently commonplace in the world of physics, but until 2013, it wasn't widely known to the Mandelbrot set community. The basic idea as far as I understand it (I'm not a math person, so bear with me here) is to do the full, painstaking, very precise calculations for one equation, then, for equations with only very slightly different values, you can do quick, less-precise math using just the difference (the “delta”) between the full calculation and the quick calculation. Then add your quick and easy delta calculation result to the original precise result, and you should have a very good approximation of the actual calculation, as if you'd done the full thing.
Applying this idea to the Mandelbrot set is straightforward. Using arbitrary precision math, do the full slow, very precise, calculations for one point on the screen (the center of the screen works) which we call the "reference point."" The position of the orbit at each iteration can be reduced down and saved as a floating point value. Then for all nearby points (all other pixels on the screen) we can use floating point math and follow along with the reference orbit, iteration by iteration. At each iteration, we'll add up the reference orbit location and the delta orbit location, and it's as if we've done the full-precision calculation. Because the Mandelbrot is supposed to be so unpredictable from one pixel to the next, it's surprising that this works in the first place, but it somehow does.
Back in 2013 this breakthrough was well-received.

Though it wasn't foolproof. When a delta orbit strays too far from the reference orbit, or when an entire group of nearby pixels all end up with the same iterations value (same color “blob”), the drawn images are quite clearly wrong in some areas. These misbehaving perturbation-computed pixels quickly became known as "glitches." When the reference orbit bails out on fewer iterations than a delta orbit, we have to transfer to another, longer, reference orbit to continue.
There were several initial attempts with various heuristics to detect and correct glitches and blobs. One year after the original perturbation theory announcement, fractalforums.com member "Pauldebrot" posted4 his solution for detecting glitches, which was the state-of-the-art from 2014-2021.
Then in 2021 another breakthrough came out of the blue. Forum user "Zhuoran" posted5 the below pseudocode to the fractalforums.org discussion board (annotated with "pt" comments by me):
// pt: I believe "START WITH ZERO" refers to the fact that we
//       can't throw away the first portion of the reference
//       orbit if series approximation is used to skip
//       iterations -- because the algorithm below must rebase
//       back to the 0th iteration.  This will be discussed in
//       a later blog post
complex Reference[]; // Reference orbit (MUST START WITH ZERO)
int MaxRefIteration; // The last valid iteration of the reference (the iteration just before it escapes)
complex dz = 0, dc; // Delta z and Delta c
int Iteration = 0, RefIteration = 0;

while (Iteration < MaxIteration) {
    // pt: the perturbation iteration equation
    dz = 2 * dz * Reference[RefIteration] + dz * dz + dc;
    RefIteration++;

    // pt: add the delta orbit to the reference orbit
    complex z = Reference[RefIteration] + dz;
    // pt: if the combined reference and delta orbit escapes, bail out
    if (|z| > BailoutRadius) break;
    // pt: if the delta is larger than the reference, or of the
    //       reference orbit has already escaped, reset back to
    //       the beginning of the SAME reference orbit!
    if (|z| < |dz| || RefIteration == MaxRefIteration) {
        dz = z;
        RefIteration = 0;
    }
    Iteration++;
}
Amazingly, we can detect and avoid perturbation glitches by resetting back to the beginning of the same reference orbit! This means that only one reference orbit needs to be computed per image, and we don't have to strategically move around the image to hunt for and calculate especially long reference orbits.
Again, I'm not a math person but I believe this works because, fundamentally, multiplying complex numbers produces a rotation in the complex plane6. When the delta orbit drifts away from the reference orbit, we just reset back to the beginning of the orbit, iterate once more, and check again. If the delta is still too far from the reference orbit, reset again, and so on. Eventually, again because both orbits are... orbits, they will join each other after a few iterations. After this happens and they are close again, we can continue iterating both orbits for many iterations again.
With K. I. Martin's1 original perturbation theory, and Zhuoran's5 glitch prevention, Very Plotter was able to quickly calculate and render Mandelbrot images at much larger scales than ever before. But just beyond the scale of 1e300, floating point numbers cannot accurately represent the extremely small delta values involved in the perturbation calculations. We need some other form of numbers in our code, and we don't want to resort to the excruciatingly-slow arbitrary precision math.
FloatExp
Thanks to forum posts by "Kalles Fraktaler"7 and "claude"8, and source code9, I was able to implement code similar to their "floatexp" idea. FloatExp is a middle ground between the double-precision floating point numbers built into programming languages (like JavaScript) and CPUs, and arbitrary precision. My implementation uses a regular JavaScript floating point value for the mantissa, and another for the exponent. It currently uses base-10 math internally but I'd like to experiment with base-2 soon, which may be faster for certain operations.
FloatExp offers up to 52 bits of significant digits, which as we've seen is plenty for accurate perturbation theory, as well as support for huge (negative) exponents, which allows very very tiny values to be used for perturbation math.
In my limited testing so far, my FloatExp implementation allows perturbation theory to be used at scales beyond 1e300. Even without any series approximation it is vastly faster than arbitrary precision at those scales.
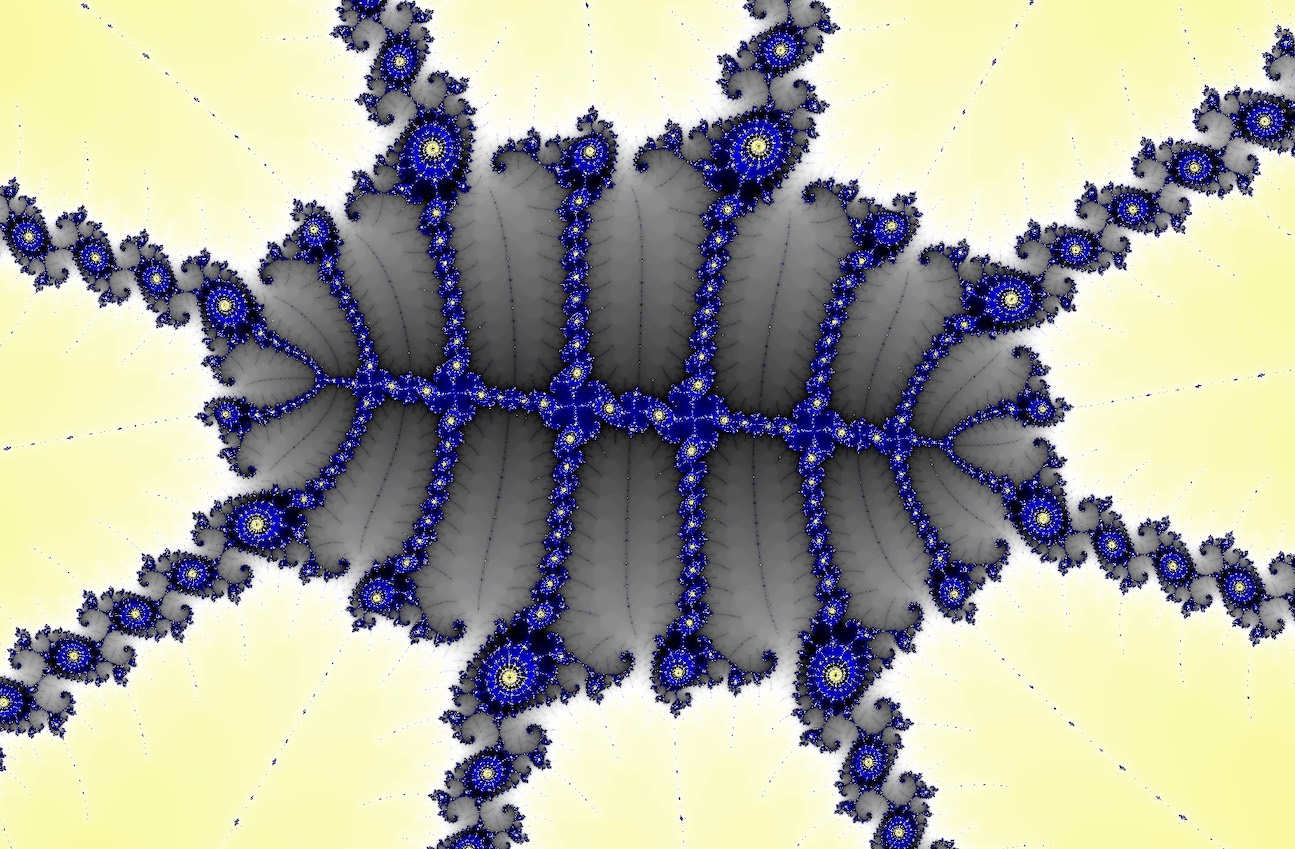
The above image was computed with perturbation theory and FloatExp. It took quite a while to complete, but still only a fraction of the time that would be required with arbitrary precision. Click the image to go to this location in Very Plotter.
Series Approximation
The original K. I. Martin perturbation theory PDF1 also described a series approximation approach for Mandelbrot set calculations. This allows many iterations to simply be skipped (for certain images, as far as I can tell).
This is the next major item on my Very Plotter roadmap, and I'm looking forward to implementing it.
References
- fractalforums.com: SuperFractalThing: Arbitrary precision mandelbrot set rendering in Java. (archived copy)
- Wikipedia: Perturbation theory
- K.I. Martin: Superfractalthing Maths (archived copy)
- fractalforums.com: Pertubation Theory Glitches Improvement (archived copy)
- fractalforums.org: Another solution to perturbation glitches
- Veritasium on YouTube: How Imaginary Numbers Were Invented
- fractalforums.com: Kalles Fraktaler 2
- fractalforums.org: fast extended range types
- code.mathr.co.uk by Claude Heiland-Allen: mandelbrot-perturbator source code — floatexp.h


