

NFL Elo Power Rankings for 2023
 I've been working on code to calculate Elo ratings for NFL teams, and thus Elo-based power rankings, for the last couple weeks.
The power rankings page for the current season is available here.
Contents
Background
I've been obsessed with 538's NFL power rankings, which also use an Elo rating-based system, during each NFL season for the last few years. Through ongoing major upheaval at 538 this year, they are not publishing their NFL Elo ratings for the 2023 season. After a few weeks without Elo ratings for this season I needed to set out to calculate them for myself.
After looking at the basics of the Elo rating system, it seemed like a problem I could sink my teeth into. The hardest part turned out to be gathering the data for games played. I settled on using Wikipedia data, which has been fine for the most part.
Since it's a bit of a chore to process the data from prior seasons, and since I've noticed that data from more than a few years ago has a negligible impact on the current Elo ratings, my ratings for the 2023 season are based on the 2013 2011 season (where all teams began with a rating of 1500) and onward.
I'll see how involved it is to keep the ratings page updated every week, but since I've been obsessed with NFL Elo ratings for the last few years, I'll likely want to keep them updated so that I can see the new ratings and power rankings for myself each week.
Model Update October 16, 2023:
The initial Elo rating model (published Oct 4th, following week 4) used in these rankings was conservative, and slow-moving. It received a lot of criticism from a vocal group on reddit (see my reddit posts following week 4 and week 5) that prefers to see power rankings that reflect recent performance. This seemed to be at odds with my goal. I want to publish only the best, most accurate, and therefore most useful, Elo ratings. I was not and still am not willing to change the model to create power rankings that look better but are less accurate.
A terrific aspect of the Elo rating system is that the model can be used to estimate game outcomes, and those estimates can be compared to actual game outcomes. This allows the accuracy of the model to be measured. If one model is less accurate than another model, the power rankings it produces are simply less meaningful.
With this in mind, over the last couple weeks I've been working on a model update that satisfies both criteria:
- reflect recent performance better (notably, the late 2022 and early 2023 Lions), and
- predict game winners and estimate margin of victory more accurately
I was able to make a few changes that did satisfy both criteria. I published updated rankings here on this site on October 5th, and again was able to find a "better" and more accurate model that incorporated a stronger "offseason parity reset," published on October 10th. The yardstick Detroit Lions climbed from 11th to 8th in the post-week 5 rankings.
Not satisfied, I tried a few more drastic changes. Today, October 16th, I am again publishing updated rankings. Again, the new model satisfies both criteria (with a caveat). The Detroit Lions now climb from 8th to 6th in the post-week 5 rankings. Aside from the Lions, other changes to the post-week 5 rankings include:
- the Bills drop from 1st to 2nd
- the 49ers move from 2nd to 1st
- the Dolphins move from 11th to 10th
- the Jaguars move from 17th to 14th
- the Jets move from 23rd to 20th
- the Ravens drop from 6th to 9th
- the Saints drop from 10th to 11th
- the Patriots drop from 21st to 26th
The Cowboys stay at 5th, interestingly. Overall, the new model seems to rank the teams closer to where a human would.
The caveat is that while both the new model and the previous model pick 1822 winners correctly out of 2785 games since week 1 of the 2013 season, the previous model has a median "Elo score" differential of 0.1152 over those games, where the new model has 0.1177.
The "Elo score" applies to a single football game, and is adjusted to fit a 0.0 to 1.0 scale. A team that gets "blown out" earns a 0.0, teams that tie earn a 0.5, and a team that wins in a blowout earns a score of 1.0. The model calculates an estimated score between 0.0 and 1.0 for each team (the sum of both teams' scores is 1.0) and then it calculates the difference between the actual margin of victory and the estimated one.
The previous model had just as many games closer than 0.1152 to the estimate than farther from it, and the new model is slightly worse.
Because the new model really does rank the teams more responsively, and because it picks the same number of winners as the previous model, I'm going to go against my better judgement a little and switch to the new model for now. The new model is also slightly simpler (one fewer parameter changes value during the season).
Over time, I imagine I'll keep playing with the models and hopefully I'll find an even better one.
Model Update November 7, 2023:
I was again able to improve the model. I went looking for improvements following the 2023 week 9 games because I felt some teams (the Bills, mostly) were ranked improperly. While the idea of changing models mid-season isn't appealing, I will stick to my original rule and only use a model that "looks better" if it actually also is a more accurate model. That's the only objective way to do it. Still, I am aware there is some bias here (if I am satisfied with how the ratings and power rankings look, I am less motivated to search for a better model). I'll have to just keep this in mind.
This new model:
- Correctly picks 2,024 game winners (out of 3,110 total games) from 2012w1-2023w9, where the previous best model picked 2,020 winners.
- Uses a larger Elo "k factor" to react more strongly to individual games.
- Decreases the "big win" margin of victory, effectively increasing the importance of wins and decreasing the importance of margin of victory.
- Slightly increases the strength of the "offseason parity reset."
- Slightly increases the value of rest days between games.
- Ranks teams closer to where a human might rank them after 2023w9:
- the Bills drop from 2nd to 4th
- the Ravens move from 3rd to 2nd
- the Eagles move from 4th to 3rd
- the Dolphins drop from 9th to 11th
- the Lions move from 10th to 9th
- the Jaguars move from 11th to 10th
Previously, I was using the median "Elo score" differential (between estimated and actual) to judge the accuracy of estimated margins of victory. In tweaking parameters for this new model, I realized that the parameter for "big win" directly affects that median value. The "Elo score" differential is now converted back into football points. This is a more intuitive unit of comparison, and allows me to directly compare different models regardless of their "big win" parameter setting. I updated the "NFL Elo Models Compared" post with this much better football points comparison.
Over 3,110 games from 2012w1-2023w9, the margin of victory differential:
- for the new model:
- median: 8.0226 points
- standard deviation: 8.4959 points
- for the previous best model:
- median: 8.0 points
- standard deviation: 8.5074 points
The new model, while picking 4 more game winners over that span, is only a hair worse when it comes to estimating margins of victory. For the purpose of model accuracy, I think I'd prefer more correctly-picked game winners than anything else, so I'll continue to use that when evaluating model changes.
I also added an additional historic season (2010) to the model, which allows using one more season (2012) for backtesting the model. The models are now tested over the 267 games from the 2012 season, bringing the total to 3,110 games through 2023w9.
Model Update November 15, 2023:
In the previous model change, I gave more weight to winning and decreased the weight of margin of victory. After getting more feedback on Reddit, I was inspired to try to find a way to continue with this same goal. I'm happy to say that I've found a model that further increases the emphasis on winning in place of margin of victory. Of course, I would only use a new model if it were more accurate than the previous best model, and this one is.
In summary, this latest model:
- Correctly picks 2,038 game winners (out of 3,124 total games) from 2012w1-2023w10, where the previous best model picked 2,032 winners.
- Applies a curve to increase the Elo scores earned from small-to-medium margins of victory, effectively tilting the balance more toward winning in general and away from large margins of victory.
- Increases the "Elo score" earned for a "narrow win" (again, increasing the importance of wins and decreasing the importance of margin of victory).
- Widens the definition of a "narrow win" and awards a linearly-increasing Elo score for those.
- Slightly increases the Elo score earned from an overtime victory.
- Slightly increases the value of rest days between games.
- The ratings and rankings change only slightly from the previous model, following 2023w10:
- the Chiefs are now rated ~2 Elo points higher than the Bills, up from <1 point
- the Lions overtake the Bengals in the rankings, moving from 8th to 7th
- the Bengals drop from 7th to 8th
- the Dolphins overtake the Chargers in the rankings, moving from 10th to 9th
- the Chargers drop from 9th to 10th
- the Eagles are now 20 Elo rating points behind the 1st place 49ers, where previously they were 25 points behind
The biggest change is using a curve, rather than a linear conversion, to map margin of victory (in football points) to Elo score (0.0 for blowout loss, 0.5 for tie, 1.0 for blowout win).
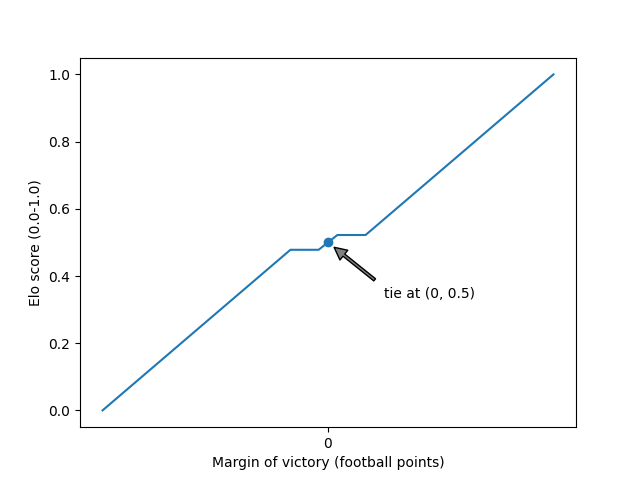
Above, we have the previous linear mapping. At the middle of the plot, we have a margin of victory of 0 football points — a tie — which earns a team the Elo score of 0.5. To the right of that point, we see a flat area where narrow margins of victory are considered equivalent. Continuing right from there, progressively larger margins of victory are worth more linearly until we reach an Elo score of 1.0 for a "blowout win." Looking to the left from center, we have negative margins of victory — losses — culminating in an earned Elo score of 0.0 when suffering a "blowout loss" on the far left of the plot.
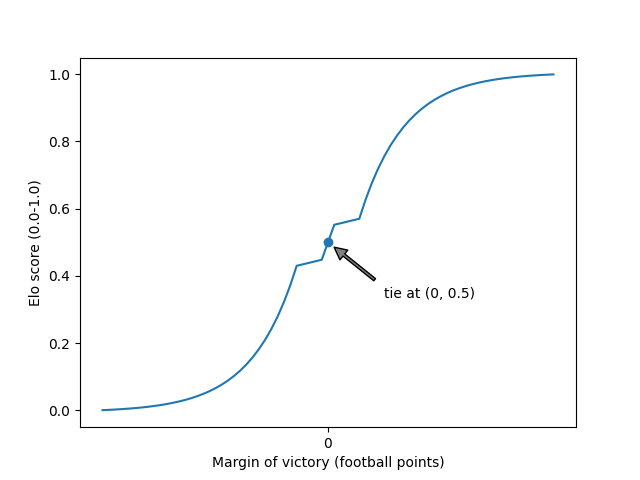
And here we have the new curved mapping (exaggerated a little to make it easier to see). We still have the 0.5 Elo score in the middle of the plot for a tie. To the right of that, we now have a short linear section where narrow margins of victory are now awarded a higher Elo score. Continuing right, over larger margins of victory, we now have a significant curve that initially awards larger, but sub-"blowout," margins of victory a higher Elo score than the previous linear mapping. As we approach the right edge of the plot we enter "blowout" territory where the curve flattens out so as not to over-reward bigger and bigger blowouts.
All of the points and slopes in the plots above are model parameters. I've previously implemented crude tooling to allow testing a range of values for each parameter, and I can now easily check the accuracy of the model over a wide range for each parameter. I was surprised to see how well the model performed with this new curve once I got all the parameters dialed in.