Smooth Colors and Slope Shading for the Mandelbrot set
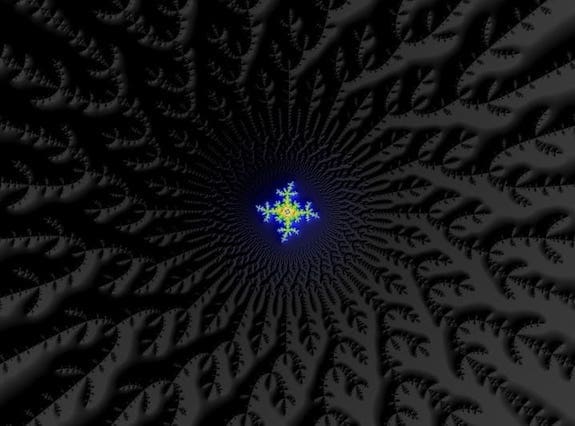 Now at version 0.8.0, Very Plotter can render the Mandelbrot set with smooth colors and slope shading. In this article we'll look at how these features were added (relatively easily!).
(Click any of the images below to view them in Very Plotter.)
Smooth Colors
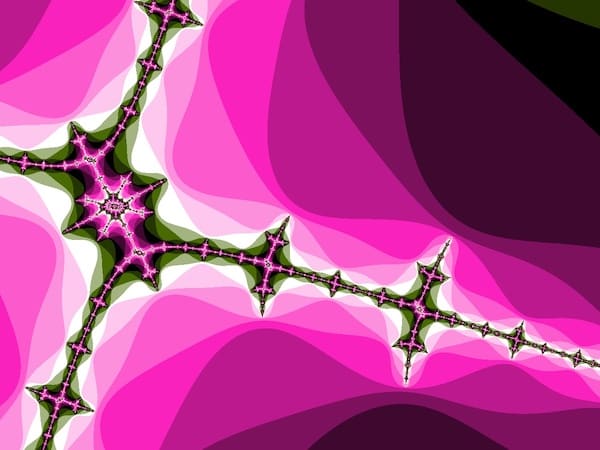
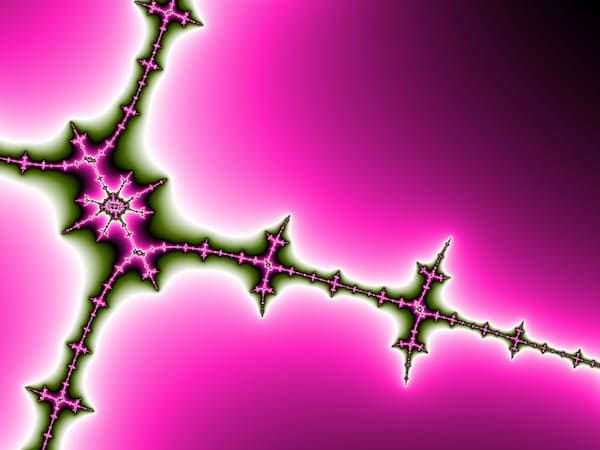
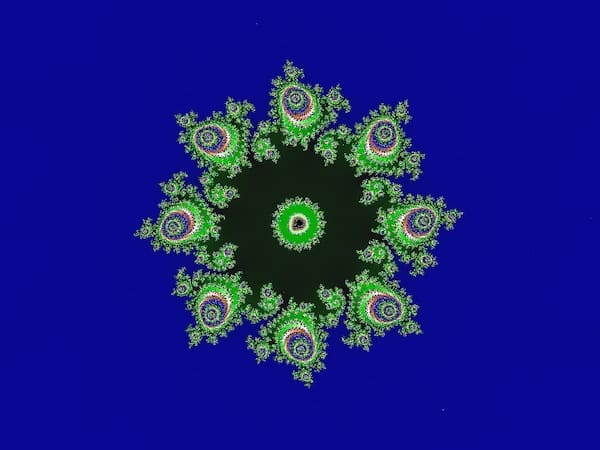
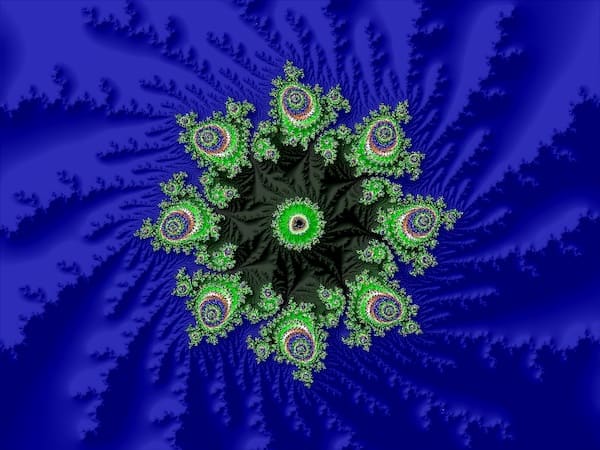
To demonstrate smooth colors, here's a location with quite a narrow gradient applied. The first image has exaggerated color banding, and the second has the new smooth setting:
Smooth colors are accomplished by calculating a separate fractional iteration count for each pixel (somewhere between 0 and 1 iterations) and adding this to the normally-computed iterations count for that pixel. Since Very Plotter was already converting iteration counts to colors using linear interpolation within a gradient, no change had to be made for calculating the pixel colors.
It turns out that it's relatively simple to compute that fractional component of the iteration count. The relevant lines of code are below (see for floating point here, and perturbation theory floatexp here):
// math.log() always returns the natural log as a floating point value,
//   so we can use regular floating point math to find the fractional
//   part to add to the iteration count
let fracIter = math.log(math.complexAbsSquared(z)) / 2;
fracIter = Math.log(fracIter / Math.LN2) / Math.LN2;
iter += 1 - fracIter;
The above code is based on the pseudocode listing in this Wikipedia article.
For locations with small scale values, floating points are used throughout the Mandelbrot set algorithm including for the log() function call, which uses JavaScript's built-in Math.log. Deeper zoom locations use "floatexp" objects (built with one floating point value for mantissa, and another floating point value for exponent) for all math operations. Calculating the natural logarithm of these floatexp objects was a little more involved, and I'll make a short blog post on that later. In the meantime, the floatexp natural log function can be seen here.
Slope Shading
Once we have smooth coloring in place (fractional iteration counts) we can use the iterations as a "height" value.
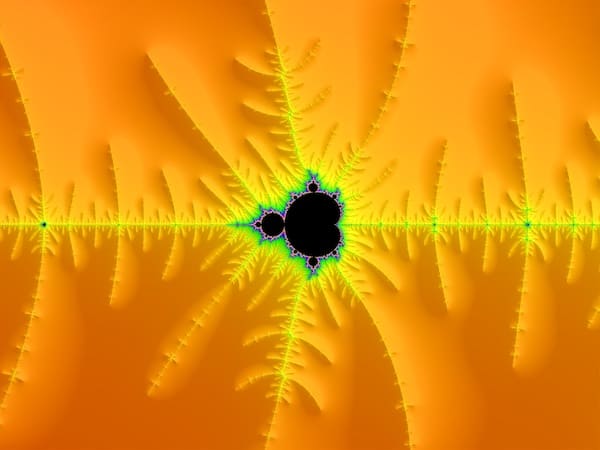
The second image for the location below shows the slope shading effect that simulates a light source in the top right of the image, with the light pointing toward the center.
Here's another example that reveals a lot more detail in areas of solid color. In the second image here, the light source is at the top left.
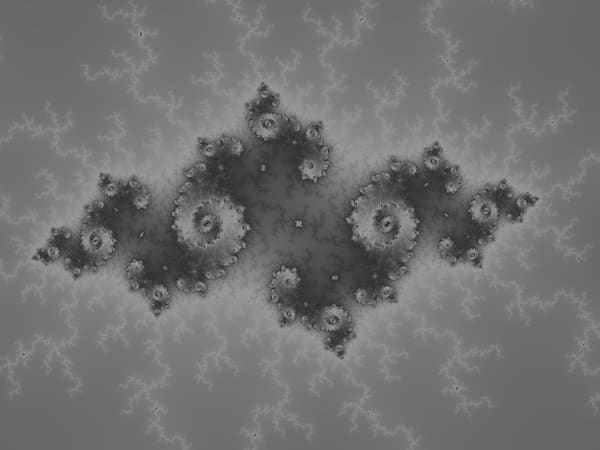
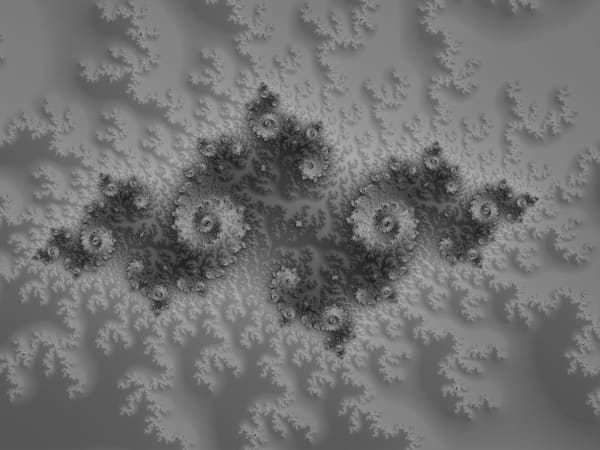
The slope shading effect can also add a lot of texture and depth to monochrome images.
There are several ways to produce this effect, including more sophisticated methods involving the mathematical derivative of the Mandelbrot set equation and 3D vector calculations, but for this first implementation I used a method that does post-processing on the iterations values of each pixel.
Based on the algorithm from this brilliant post by "mrrudewords" on fractalforums.org, I implemented slope shading using the difference in iterations value between each pixel and its eight neighboring pixels. I extended the algorithm to allow the light source to be placed toward the top/bottom and left/right of the image.
We sum the differences for all eight neighboring pixels to come up with a value to add (which may be negative) to the red/blue/green color components for each pixel:
- for each subject pixel:
- if the pixel is in the interior of the Mandelbrot set, do not apply this algorithm
- establish a running sum of zero
- establish overall high and low iterations counts for the pixel and its neighbors, both initialized to the subject pixel's iterations value
- for each neighbor pixel of the subject pixel:
- assign the neighbor pixel's iteration count to the overall high iterations count, if higher
- assign the neighbor pixel's iteration count to the overall low iterations count, if lower
- take the difference in iteration count between the neighbor pixel and the subject
- assign this difference to two separate variables: vertical difference and horizontal difference
- if the light position is at the bottom of the image, negate the vertical difference
- if the light position is at the top right or bottom left of the image, negate the horizontal difference
- if the neighboring pixel's
xposition is greater than the subject pixel's, subtract the horizontal difference from the running sum, otherwise, add it - if the neighboring pixel's
yposition is greater than the subject pixel's, subtract the vertical difference from the running sum, otherwise, add it
- multiply the completed running sum by a height factor (somewhere between 2 and 20 works well, depending on how "steep" you want the slopes to appear)
- divide that product (sum * height) by the difference between the overall high and low iterations counts to get the final color modification value
- add that final modification value to each red/blue/green component of color for the subject pixel (obviously, restricting each new red/blue/green value to the 0-255 range)
The source code may be easier to follow than the above description, and can be seen here.


