

NFL Elo Power Rankings for 2024
 The 2024 NFL season is here!
I've been working on Elo model improvements, off and on, for the entire offseason. I'm excited to share some improvements.
The new 2024 season ratings and rankings page is live!
(The 2023, 2022, and 2021 pages are available and updated with the new model described below.)
Elo model Background
Before getting started, I'd like to explain why I think an Elo rating model, and one that uses margin of victory, is useful for ranking NFL teams.
The Elo rating system was created to compare the playing strength of chess players. Each player earns a numeric rating, where an average player would earn a rating of 1,500 and very strong players can earn a rating well over 2,500. Over a series of one or more games, against one or more opponents, a player's expected winning percentage can be calculated. Following the game(s) the difference between the actual and expected winning percentages are used to calculate an updated rating. If a player does better than expected, their rating increases. If they perform below expectations, their rating decreases. If they play as expected, their rating remains the same.
In applying this system to the NFL, we can't treat an NFL game like a single chess game. Each move in a chess game directly prevents or enables large sets of future moves, tightly constraining the options available to both the player and their opponent based on the sequence of preceding moves. After a few early blunders a chess player can lose the game having played only a few moves. Neither of these aspects of chess apply to an NFL game. In the NFL, offenses can choose to run, pass, punt, attempt a field goal, etc., at any point regardless of the game situation or which plays they or their opponent have run. And after a scoring drive, an NFL team kicks to their opponent and a new drive begins — to some degree the game is reset. Nothing like this happens in a single chess game.
A better way to apply Elo to the NFL is to consider an NFL game analogous to a series of chess games, perhaps like a multi-game chess match. Over a series of chess games there will be some strategy adjustment but the individual games will be largely independent. Similarly, an NFL game is comprised of largely independent drives. In order to increase the likelihood of winning the game, NFL offenses generally attempt to score on every drive. There are exceptions to this, such as drives where the score is already lopsided or where a team attempts to run out the clock rather than score, but for the most part each drive is somewhat independent: the offense is trying to score, and the defense is trying to prevent a score.
If we use the drives analogy, the cumulative result of the 10+ drives per game per team is the margin of victory. Where a "won" drive can be a score on offense, preventing a score on defense, pinning the opponent back with a good punt, or running out the clock successfully, a team that "wins" more drives than its opponent will likely win and will likely end up with a larger margin of victory.
In continuing this analogy, in place of computing an expected winning percentage over a series of chess games, for an NFL game we can compute an expected margin of victory (or margin of defeat) for each team. Following the NFL game both teams' Elo ratings are updated based on their actual-vs-expected margin of victory. There are two common situations worth mentioning here. First, if the winning team wins by a smaller than expected margin, they will lose Elo rating points. Secondly, if a team loses but by a smaller than expected margin, they will gain Elo rating points. Neither of these can happen following a single chess game, but again, we are not treating an NFL game like a single chess game. After a series of games in a multi-game match or tournament, chess players can also, for example, win a match with a lower than expected winning percentage and lose Elo rating points.
One caveat here is that there are many more factors that must be taken into account to increase the accuracy of an Elo model when applying it to NFL games. The model used here uses the home/away/neutral venue status for each team, the number of rest days, and a few other factors, when calculating the expected margin of victory for each team. These factors, as well as parameters defining a "close win," "blowout win," etc., are all weighted to produce a model that picks the most game winners.
I mentioned earlier that there are situations where an NFL team will intentionally try not to score (or in rare cases even allow the opponent to easily score!) in an effort to increase their odds of winning the game. In order to not penalize teams for these strategies we cannot, for example, treat a 70-point victory as being 10 times as valuable as a 7-point victory. Instead, we have to reward margin of victory on a curve where proportionally more value is placed on each additional point of margin of victory in narrow wins than on each additional point in bigger wins. No additional value is awarded for scoring more points in blowout wins. More background on implementing the curve was given in an update on the 2023 NFL Elo post.
Power Rankings vs Elo Ratings
Once we have Elo ratings for each NFL team, we can simply arrange them in order to get our power ranking.
For any two teams, their Elo ratings are a measure of how they are expected for perform against each other at a neutral site, with the same number of days' rest since the last game, etc.
To clarify: to compare two teams we must look at their Elo ratings, not their power rankings. Take for example one team, ranked #5 in the league with an Elo rating of 1530, and another team at #9 in the league with an Elo rating of 1528. At 1530 and 1528, those teams are very close in Elo rating. The fact that they are ranked 5th and 9th does not matter. Teams with ratings only a few Elo points apart like this are expected to be roughly the same strength. A game between these hypothetical teams would likely be a "Tossup" without a meaningful margin of victory expected for either team.
2023 Retrospective
Let's look at how the 2023 season Elo ratings compared to playoff seeding. Matching the playoff seeding is not the goal of these Elo ratings, but it's interesting to see how closely they matched at the end of the regular season.
For the AFC playoff bracket, the 1-3 seeds were all in Elo order, and aside from the Texans, the other AFC playoff teams were seeded very close to their Elo ranking among AFC teams. The Texans had a very good season Elo-wise, and aside from their week 14 loss to the Jets they steadily increased in Elo rating throughout the season. As division winners they earned the #4 AFC playoff seed, far ahead of their 12th-best AFC Elo rating.
| AFC Elo Rank | AFC Playoff Seed | Team | Record |
|---|---|---|---|
| 1 | 1 | Baltimore Ravens | 13-4 |
| 2 | 2 | Buffalo Bills | 11-6 |
| 3 | 3 | Kansas City Chiefs | 11-6 |
| 12 | 4 | Houston Texans | 10-7 |
| 7 | 5 | Cleveland Browns | 11-6 |
| 4 | 6 | Miami Dolphins | 11-6 |
| 8 | 7 | Pittsburgh Steelers | 10-7 |
The NFC seeding was also quite close to the NFC Elo rankings. Tampa Bay won their division and earned the #4 seed, boosting them well ahead of their 7th NFC Elo ranking. The Eagles' Elo rating had collapsed by the end of the season, but their early-season wins meant they earned the #5 seed while only having the 8th-best NFC Elo rating.
| NFC Elo Rank | NFC Playoff Seed | Team | Record |
|---|---|---|---|
| 1 | 1 | San Francisco 49ers | 12-5 |
| 2 | 2 | Dallas Cowboys | 12-5 |
| 3 | 3 | Detroit Lions | 12-5 |
| 7 | 4 | Tampa Bay Buccaneers | 9-8 |
| 8 | 5 | Philadelphia Eagles | 11-6 |
| 5 | 6 | Los Angeles Rams | 10-7 |
| 6 | 7 | Green Bay Packers | 9-8 |
Before the Super Bowl, the 1583-rated 49ers were the "Slight favorite" over the 1565-rated Chiefs at the neutral Super Bowl site. Given that the game went to overtime I don't think this Elo rating-based expectation was too far off.
Post-2023 "Frozen" Pages
Finally, before moving onto changes for 2024, I'd like to share links to "frozen" versions of the rankings pages as they appeared at the end of last season:
Frozen as of February 2024: 2021
Frozen as of February 2024: 2022
Frozen as of February 2024: 2023
Frozen as of February 2024: 2021-only ("blank slate" model)
Frozen as of February 2024: 2022-only ("blank slate" model)
Frozen as of February 2024: 2023-only ("blank slate" model)
My intention with these "frozen" pages is to keep them as they originally appeared at the time of freezing. I may want to do model updates every offseason, and in that case I'd like to keep a record of the old Elo models' rankings and ratings.
2024 Changes
For the 2024 season, the Elo rating system is moving to a substantially more accurate model. I am calling this new model v2.2024.07 since it was discovered using a new process detailed below.
The best Elo model used during the 2023 season correctly picks 2,118 out of 3,259 game winners (65.0%) over the 12 seasons from 2012-2023. The new v2.2024.07 model picks 2,161 of 3,259 game winners (66.3%) over that span, which averages a net of 3.58 more correctly-picked games per season.
Next, I'll give some details on how this new model was found.
2024 Model Updates: Embracing Randomness
My goal from last year hasn't changed:
"I want to publish only the best, most accurate, and therefore most useful, Elo ratings. I was not and still am not willing to change the model to create power rankings that look better but are less accurate."
For the 2023 season, while searching for the best (most accurate) Elo model to use, I tested various models with parameter settings that made intuitive sense to me. I could try a few ideas, see which models worked best, and "fine tune" the good ones by hand (honing in on exact fractional values that ended up picking more game winners correctly). A few times during the season, following feedback from my posts on reddit, I went back to the drawing board and ended up finding better models. Details for those updates were published on the 2023 version of this page.
For the upcoming 2024 season, again with the goal of finding the best possible Elo model, I wanted to test many many more models.
I realized early on that there is no way to systematically test every possible model. The Elo model used in this project has well over 20 parameters, many of which are decimal numbers for which a tiny adjustment can have a drastic effect on the accuracy of the model. On top of that the parameters seem to interact in chaotic, unpredictable ways.
I love algorithms involving randomness, so I implemented one to search for Elo models. The basic idea is to simply generate randomized models and test them over the 12 years' worth of games. Most random models will be rubbish, but some are quite good. Given that I don't know which values for which parameters will result in the best model, and that I don't want to impose any of my biases upon the model, I'm not sure there is a better way to search for the best possible model other than through a randomized search method similar to this. Aside from some bias sneaking in via the lower and upper bounds on each parameter's search space, I think this search method satisfies my goal of looking for and using the best possible model for this Elo rating system.
After some initial testing, I found I can generate and test thousands of models every minute (per CPU core). In order to find the "best" models among the millions I'd be generating, I needed to find a way to sort them.
Models are compared on two criteria:
- number of game winners correctly picked:
- after adjustments for rest days, home vs. away, and so on, whichever team has the higher expected performance from 0.0 (blowout loss) to 1.0 (blowout win) is the modeled winner
- if, after these adjustments, both competing teams' expected performance rounds to 0.5, then neither is the "expected" winner
- if the game ends up in a tie, then the model is awarded a "correctly picked" game, or
- for the new model this only occurred for WAS@NYG, 2022 wk. 13
- if the game goes to overtime, and the team with the higher expected performance wins, the model is awarded a "correctly picked" game
- even a very slight expected advantage still counts as a correct pick
- if the game goes to overtime, and the team with the lower expected performance wins, the model is awarded 1/2 of a "correctly picked" game
- for the new model this occurred for TB@CAR, 2012 wk. 11, and IND@DEN, 2022 wk. 5
- if the game ends up in a tie, then the model is awarded a "correctly picked" game, or
- the last week of each regular season is omitted from the model comparison because very strong teams will often intentionally rest players and lose to weaker teams
- standard deviation of correctly-picked winners percentage, across all seasons
- the percentage is the above "winners correctly picked" count divided by the number of games in the season
- omitting last week of regular season since it's not helpful for comparing models when strong teams, with inconsequential final games, sometimes rest starters
- where percentages are scaled from 0.0% to 100.0%
- I will abbreviate this "stddev." from here on
- the percentage is the above "winners correctly picked" count divided by the number of games in the season
Since more correctly-picked game winners is better, and a lower stddev. is better, these two criteria are combined into a single value for sorting with the formula:
I came up with this formula by generating a ton of randomized winners/stddev. pairs, and sorting them according to various formulas. The above formula seemed to place models in an order that I agreed with. For example, a model that picks 2,030 game winners correctly over several seasons, with a stddev. of 1.9% across those seasons, is inferior to a model that picks one fewer game winner correctly, 2,029, but has a lower stddev. of 1.7%.
Note: By including the stddev. criterion I should be avoiding most problems with overfitting, because models that more consistently pick winners are more highly-ranked. Either way, I'm not too concerned with overfitting since I expect to repeat this same model search next offseason. If this year's model is overfitted to the 2010-2023 seasons, at the expense of 2024 accuracy, then I'd expect some other model to be better overall from 2010-2024.
I was surprised to see how quickly randomized models were found that were better than my best hand-adjusted model! My best hand-adjusted model used during the 2023 season correctly picks 2,118 out of 3,259 game winners (65.0%) over the 12 seasons from 2012-2023. The best models seemed to asymptotically approach 2,150 winners correctly picked, with many reaching the 2,140 mark and only a few here and there surpassing 2,145 (65.8%).
It was fun to let the model search run for a few hours (or days) at a time, and check in on its best found models.
2024 Model Updates: Merging Models
Inspired by genetic algorithms, I next tried the idea of merging pairs of good models to see if any better "child" models could be found — and it worked! Pairs of models have around 20 parameters that are different between them, which means there are 220 (around 1 million) "child" models, with every possible combination of those parameters, to evaluate for each pairing. Depending on how aggressively inferior-looking models are dropped, this can take anywhere from 1 to 5 full days to run on my computer for each model pair, but it only needed to be run a handful of times when a really promising new model was discovered.
On June 12, 2024, a combination of parameters from a 2,147 game winners model, merged with another model with slightly fewer winners but better stddev., produced a "child" model that picks 2,150 winners correctly (66.0%).
On July 8, 2024, another pair of models, both with fewer than 2,150 winners picked, produced a "child" model that picks 2,158 winners correctly (66.2%). This was the first model to break the 66% pick rate!
On July 27, 2024, the above model was merged with a new low-stddev. model (itself merged from new two low-stddev. models). Two child models were found that were better than all the rest. One with 2,161 picked winners (66.3%) and one with 2,159 winners but a better stddev. number. In the end, I decided to go with the 2,161 winners model because it does beat out the 2,159 model with both the overarching "more winners" criterion and the above model sorting formula.
With training camp and preseason games rapidly approaching, and more work needing to be done on season page improvements and backend verification, I declared this the final model found for the 2024 offseason. I am calling this new model v2.2024.07 with a release.year.month format so I can tell at a glance which model I am using and when it was found.
2024 Model Updates: Notable Models Compared
Here is a comparison, by season, of the best 2023 model and the v2.2024.07 model:
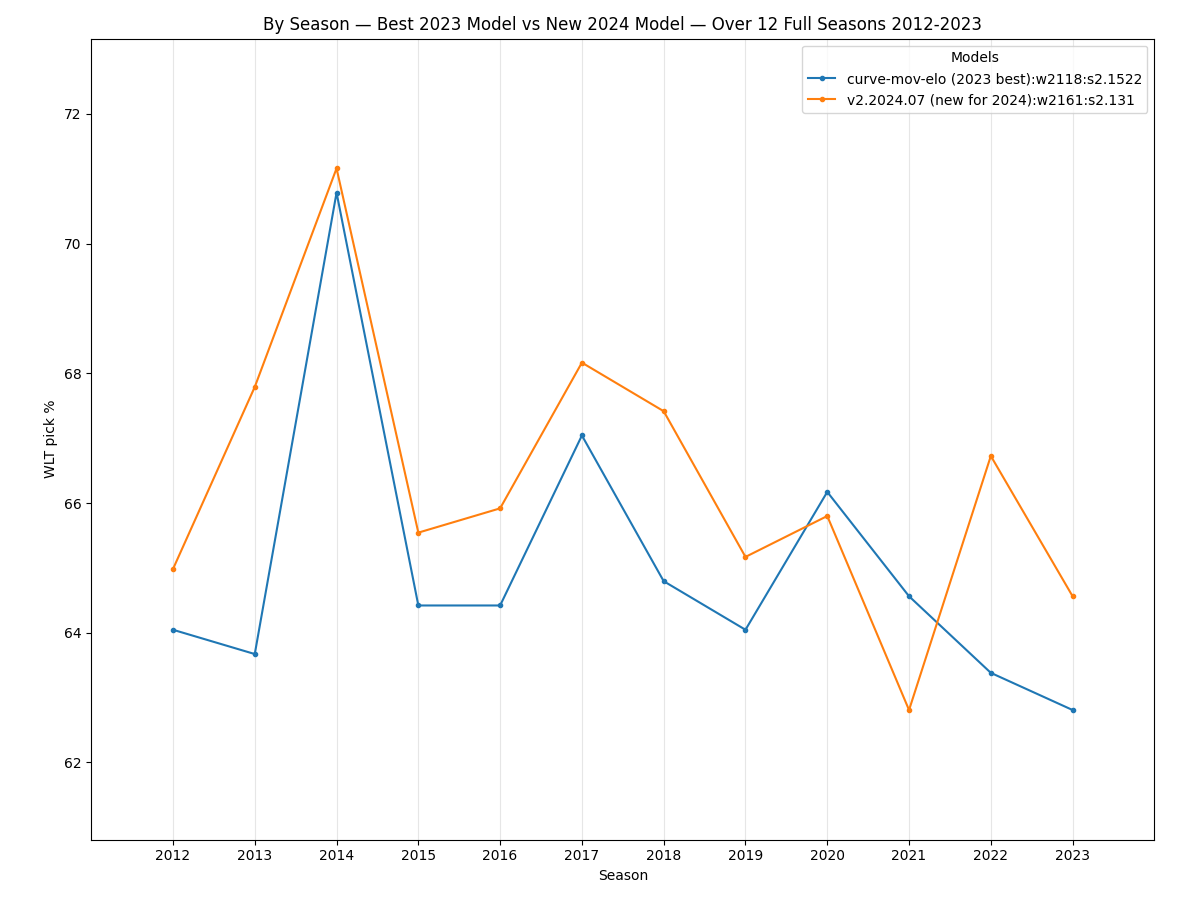
Except for 2020 and 2021 the new model is a very good improvement when looking at overall pick percentage by seasons. Even 2014, which was a very predictable season for the previous model, was improved upon by this new model.
And here is the comparison by week of season:
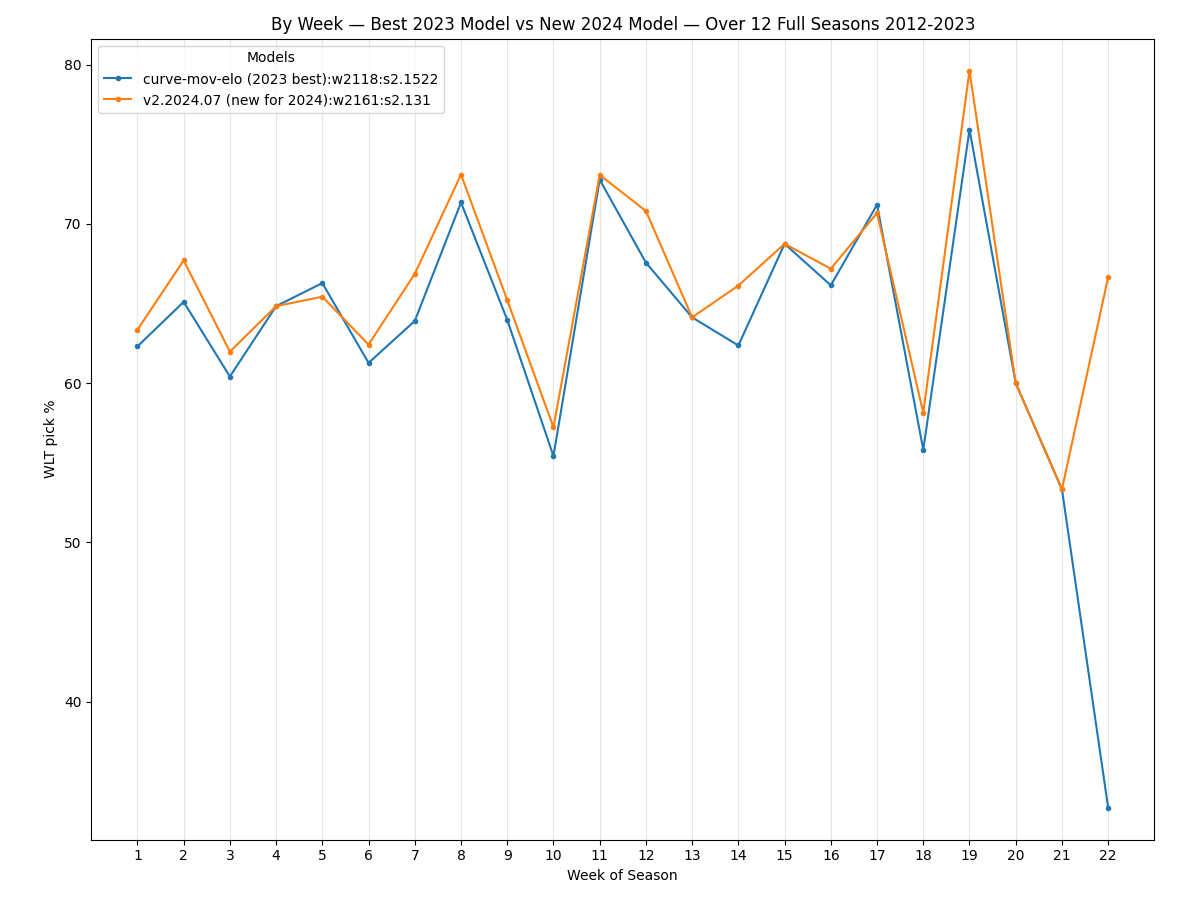
We can see the new v2.2024.07 model
picks more games correctly for most weeks, and when it lags behind the previous model (weeks 5 and 17) it does
so only by a little. Don't read too much into the last few weeks of the season on this plot. Pick percentages
can swing wildly because there are so few games played in playoff weeks compared to regular season weeks.
Interestingly, week 10 appears to be universally unpredictable — even when looking at the results of a variety of models. Some weeks give many models trouble, like weeks 3 and 6, but none seem to be as troublesome for all models as week 10:
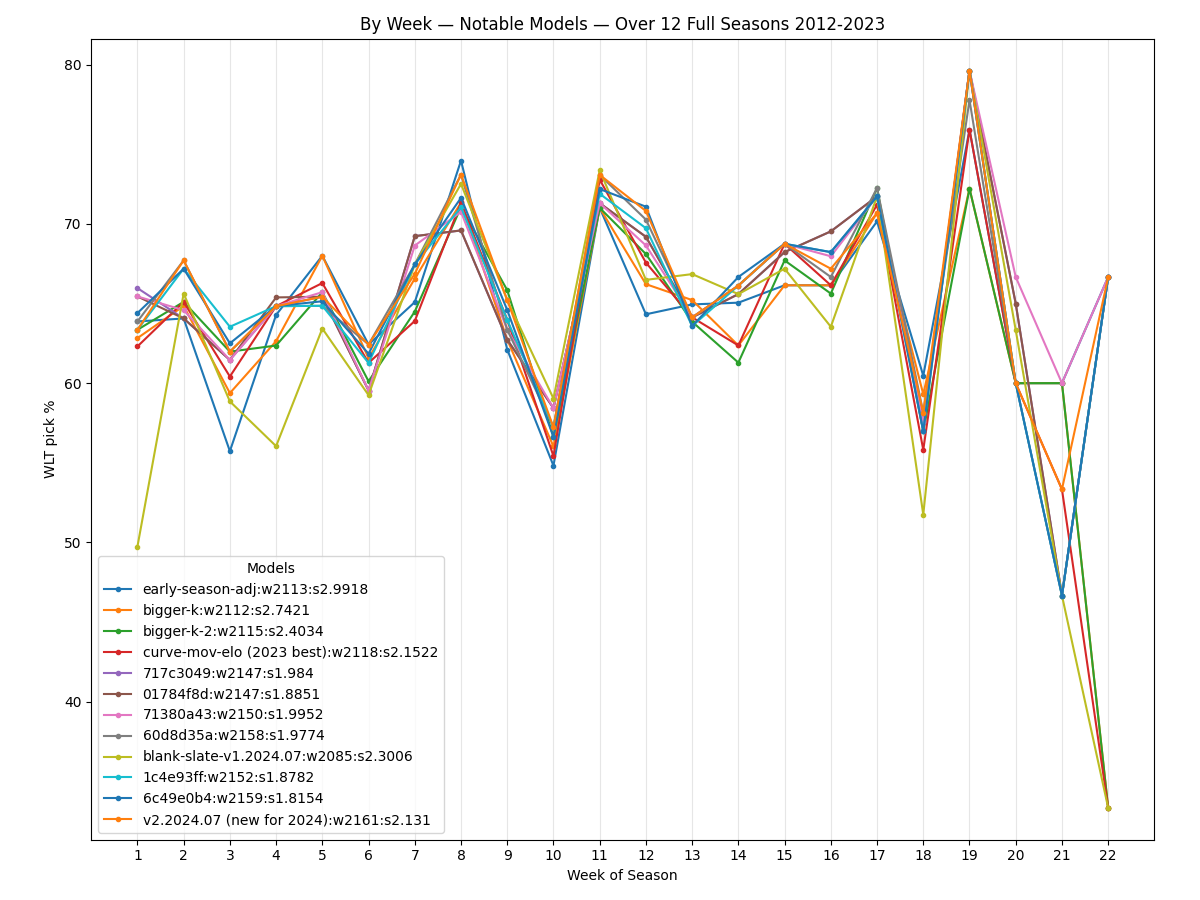
I believe this week 10 problem may be caused by some aspect of the system I've developed and is not actually revealing some subtlety of NFL player contracts/incentives, rules around injuries, pension qualifications, or similar wrinkle I've overlooked. If you think this week 10 unpredictability might actually have some cause(s) beyond my Elo model, please let me know.
2024 New "Blank Slate" Model
For the 2023 season, I published both the regular and "blank slate" versions of the rankings pages. The "blank slate" page used the same model as the regular page, but with one change: all teams were reset to a 1500 rating every offseason. The regular model does adjust all teams a little bit toward the 1500 average every offseason, but the blank slate version performs the full reset to 1500.
While less accurate than the regular model, the blank slate pages are fun to look at. By "less accurate" I am referring to the ability of the model to accurately pick game winners. In comparison with the regular model, the blank slate version of the 2023 model was much less accurate at the beginning of the season (because for the most part, strong teams stay relatively strong in the subsequent season) and only slightly less accurate at the end of the season (where both models had nearly converged on the same ratings and rankings for the league, but the regular model was still slightly more accurate).
For the 2024 season, I've attempted to find a better blank slate model by doing the same randomized model search as described above, but this time with the full reset to 1500 every offseason. My guess was that, given the annual reset, some other set of model parameters would be more accurate than simply using the rest of the regular model parameters. I quickly found that this was true, and I was able to find a model that picks 2,085 of 3,259 game winners from 2012-2023 (64.0%) with a standard deviation of 2.30% of picked winners percentage across seasons.
Simply taking the best known regular model, which picks 2,161 winners from 2012-2023, and changing one parameter to get the reset-to-1500 behavior creates a model that picks only 2,026 of 3,259 game winners over that span (62.2%) with a standard deviation of 2.59% (up from 2.13%) picked winners percentage across seasons.
In short: by looking for a better blank slate model, I was able to improve the blank slate page model from a 62.2% rate of picking winners to 64.0%. In the next section, I'll show a more detailed breakdown comparing the two models.
Comparing Regular and "Blank Slate" Models
To compare the best found regular and blank slate models, let's first look at picked winners accuracy by week. We'd expect the blank slate model to pick about 50% of winners in the first week, then improve in the following weeks. We do see what we expect:
![]()
It might be just random chance, but the blank slate model appears to be roughly as accurate as the regular model toward the end of the regular season, but in the playoffs the regular model is much more accurate.
When comparing the two models by season, the blank slate model does match the regular model for the 2016, but in general is less accurate:
![]()
The data from the above plots is provided here in table form.
| Game Winners Picked By Week of Season | ||
|---|---|---|
| Span | v2.2024.07 |
blank-slate-v1.2024.07 |
| 191 gm on wk 1 | 121 (63.35%) | 95 (49.74%) |
| 192 gm on wk 2 | 130 (67.71%) | 126 (65.62%) |
| 192 gm on wk 3 | 119 (61.98%) | 113 (58.85%) |
| 182 gm on wk 4 | 118 (64.84%) | 102 (56.04%) |
| 175 gm on wk 5 | 114 (65.43%) | 111 (63.43%) |
| 173 gm on wk 6 | 108 (62.43%) | 102 (59.25%) |
| 169 gm on wk 7 | 113 (66.86%) | 114 (67.46%) |
| 171 gm on wk 8 | 125 (73.1%) | 124 (72.51%) |
| 161 gm on wk 9 | 105 (65.22%) | 105 (65.22%) |
| 166 gm on wk 10 | 95 (57.23%) | 98 (59.04%) |
| 169 gm on wk 11 | 124 (73.08%) | 124 (73.37%) |
| 185 gm on wk 12 | 131 (70.81%) | 123 (66.49%) |
| 184 gm on wk 13 | 118 (64.13%) | 123 (66.85%) |
| 186 gm on wk 14 | 123 (66.13%) | 122 (65.59%) |
| 192 gm on wk 15 | 132 (68.75%) | 129 (67.19%) |
| 192 gm on wk 16 | 129 (67.19%) | 122 (63.54%) |
| 191 gm on wk 17 | 135 (70.68%) | 137 (71.73%) |
| Game Winners Picked On+After Week of Season | ||
|---|---|---|
| Span | v2.2024.07 |
blank-slate-v1.2024.07 |
| 3,259 gm on+after wk 1 | 2,161 (66.31%) | 2,085 (63.98%) |
| 3,068 gm on+after wk 2 | 2,040 (66.49%) | 1,990 (64.86%) |
| 2,876 gm on+after wk 3 | 1,910 (66.41%) | 1,864 (64.81%) |
| 2,684 gm on+after wk 4 | 1,791 (66.73%) | 1,751 (65.24%) |
| 2,502 gm on+after wk 5 | 1,673 (66.87%) | 1,649 (65.91%) |
| 2,327 gm on+after wk 6 | 1,558 (66.97%) | 1,538 (66.09%) |
| 2,154 gm on+after wk 7 | 1,450 (67.34%) | 1,436 (66.64%) |
| 1,985 gm on+after wk 8 | 1,338 (67.38%) | 1,322 (66.57%) |
| 1,814 gm on+after wk 9 | 1,212 (66.84%) | 1,198 (66.01%) |
| 1,653 gm on+after wk 10 | 1,108 (67.0%) | 1,092 (66.09%) |
| 1,487 gm on+after wk 11 | 1,012 (68.09%) | 994 (66.88%) |
| 1,318 gm on+after wk 12 | 889 (67.45%) | 870 (66.05%) |
| 1,133 gm on+after wk 13 | 758 (66.9%) | 748 (65.98%) |
| 949 gm on+after wk 14 | 640 (67.44%) | 624 (65.81%) |
| 763 gm on+after wk 15 | 517 (67.76%) | 502 (65.86%) |
| 571 gm on+after wk 16 | 385 (67.43%) | 374 (65.41%) |
| 379 gm on+after wk 17 | 256 (67.55%) | 252 (66.36%) |
| Game Winners Picked By Season | ||
|---|---|---|
| Span | v2.2024.07 |
blank-slate-v1.2024.07 |
| 267 gm of 2012 season | 173.5 (64.98%) | 172.0 (64.42%) |
| 267 gm of 2013 season | 181.0 (67.79%) | 179.0 (67.04%) |
| 267 gm of 2014 season | 190.0 (71.16%) | 178.5 (66.85%) |
| 267 gm of 2015 season | 175.0 (65.54%) | 172.0 (64.42%) |
| 267 gm of 2016 season | 176.0 (65.92%) | 176.0 (65.92%) |
| 267 gm of 2017 season | 182.0 (68.16%) | 169.0 (63.30%) |
| 267 gm of 2018 season | 180.0 (67.42%) | 171.0 (64.04%) |
| 267 gm of 2019 season | 174.0 (65.17%) | 169.5 (63.48%) |
| 269 gm of 2020 season | 177.0 (65.80%) | 176.0 (65.43%) |
| 285 gm of 2021 season | 179.0 (62.81%) | 169.5 (59.47%) |
| 284 gm of 2022 season | 189.5 (66.73%) | 180.5 (63.56%) |
| 285 gm of 2023 season | 184.0 (64.56%) | 172.0 (60.35%) |
2024 Season Page Improvements
Aside from the model updates, during the offseason the following improvements were made to the pages:
- The "Season Stats and Tidbits" section now lists all 32 teams for several stats, where previously only the top 5 teams in each category were shown.
- Added a new "Season Model Accuracy" section showing how many game winners were correctly picked by the model.
- Added buttons to navigate to the previous and next season pages
2024 In-season Changes
If the model or pages are changed during the season, I'll post those updates here.
New "No Margin of Victory" Model November 12, 2024
Added separate "no margin of victory" pages, where the winning team always takes Elo rating points from the losing team. They are less accurate than the regular model (picking 3.9 fewer game winners per season) but are popularly requested on Reddit.
I may discontinue publishing this separate model because it turned out to be less accurate than the somewhat similar "never lose elo for a win" model.
New "Never Lose Elo for a Win" Model November 14, 2024
Added separate "never lose elo for a win" pages, where the favorite loses 0 Elo rating points for a win by the expected margin or less. They are slightly less accurate than the regular model for now (picking 0.75 fewer game winners per season).
I'm publishing this model after only a relatively short search for the best possible model. With a much longer model search this offseason, this model may end up surpassing the regular model for accuracy!